DeepSpaceDB ver.2.0, a spatial transcriptomics database, has been released and newly includes high-resolution Xenium data
- Others
- Funding
- Database Integration Coordination Program
On Jan 16, 2026, DeepSpaceDB ver. 2.0, a spatial transcriptomics database developed by Associate Professor VANDENBON Alexis and his colleagues at the Institute of Medical and Biological Sciences, Kyoto University, was released, adding new high-resolution Xenium data. Details of this update were published on the same day via the preprint archive bioRxiv .
DeepSpaceDB, which was released on Sep 4, 2024, contains almost all publicly available data collected on 10X Genomics' Visium platform, the most widely used platform, and it provides tools that allow researchers without special informatics skills to easily perform advanced analyses, and has been used by many researchers.. On Jan 16, 2026, Associate Professor VANDENBON Alexis and his colleagues updated DeepSpaceDB to include new data obtained by Xenium platform.
In the case of Visium platform, the detection spot size is approximately 55 µm in diameter, and one spot area may contain several to 10 cells. In contrast, Xenium platform directly images the positions of RNA molecules of up to 5,000 genes at subcellular resolution and maps them to individual cells, making it possible to detect gene expression at single-cell resolution. On the other hand, Xenium data files are significantly larger than Visium data files, leading to very slow image display and interactive analysis on the web. To address this, Dr. VANDENBON Alexis and his colleagues made Xenium data more accessible by processing it in the Zarr format. They then developed a new interface specifically for Xenium data, enabling users to view and analyze high-resolution Xenium data without frustration
DeepSpaceDB supports interactive analysis functions for Xenium data, similar to Visium data. In addition to basic features for visualizing gene expression patterns in tissue sections, it enables users to freely select multiple regions within a tissue section using the mouse cursor and compare gene expression between those regions.
To access Xenium data, open the Database tab in DeepSpaceDB and check the Xenium checkbox under Platform in the side menu.
For more information, see the preprint archive "DeepSpaceDB 2.0: an interactive spatial transcriptomics database for large-scale Xenium data exploration ."
<Number of Data Points in DeepSpaceDB> (as of Jan 16, 2026)
| Species | Visium V1 | Visium V2 | Xenium |
|---|---|---|---|
| Human | 1,020 samples | 341 samples | 432 samples |
| Mouse | 648 samples | 135 samples | 187 samples |
| Mouse | 0 samples | 0 samples | 9 samples |
DeepSpaceDB is developed as a part of JST Database Integration Coordination Program (DICP), "Development of a database for spatial genomics data analysis " (Principal Investigator: VANDENBON Alexis, Associate Professor, Institute for Life and Medical Sciences, Kyoto University).
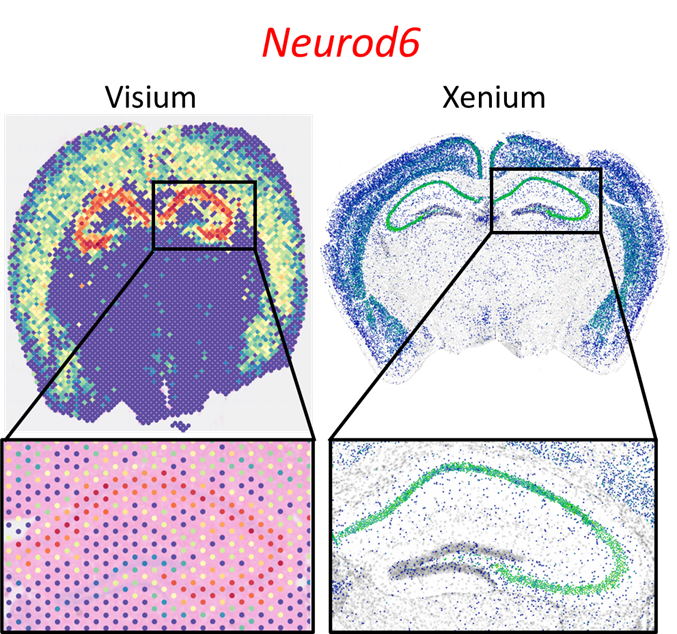
Fig 1: Comparison of Resolution Between Visium and Xenium Data
Comparison of the difference in resolution between Visium and Xenium. The plots show expression of the same gene (Neurod6) in two similar mouse brain samples. One is from the Visium platform (left) and one of the Xenium platform (right).
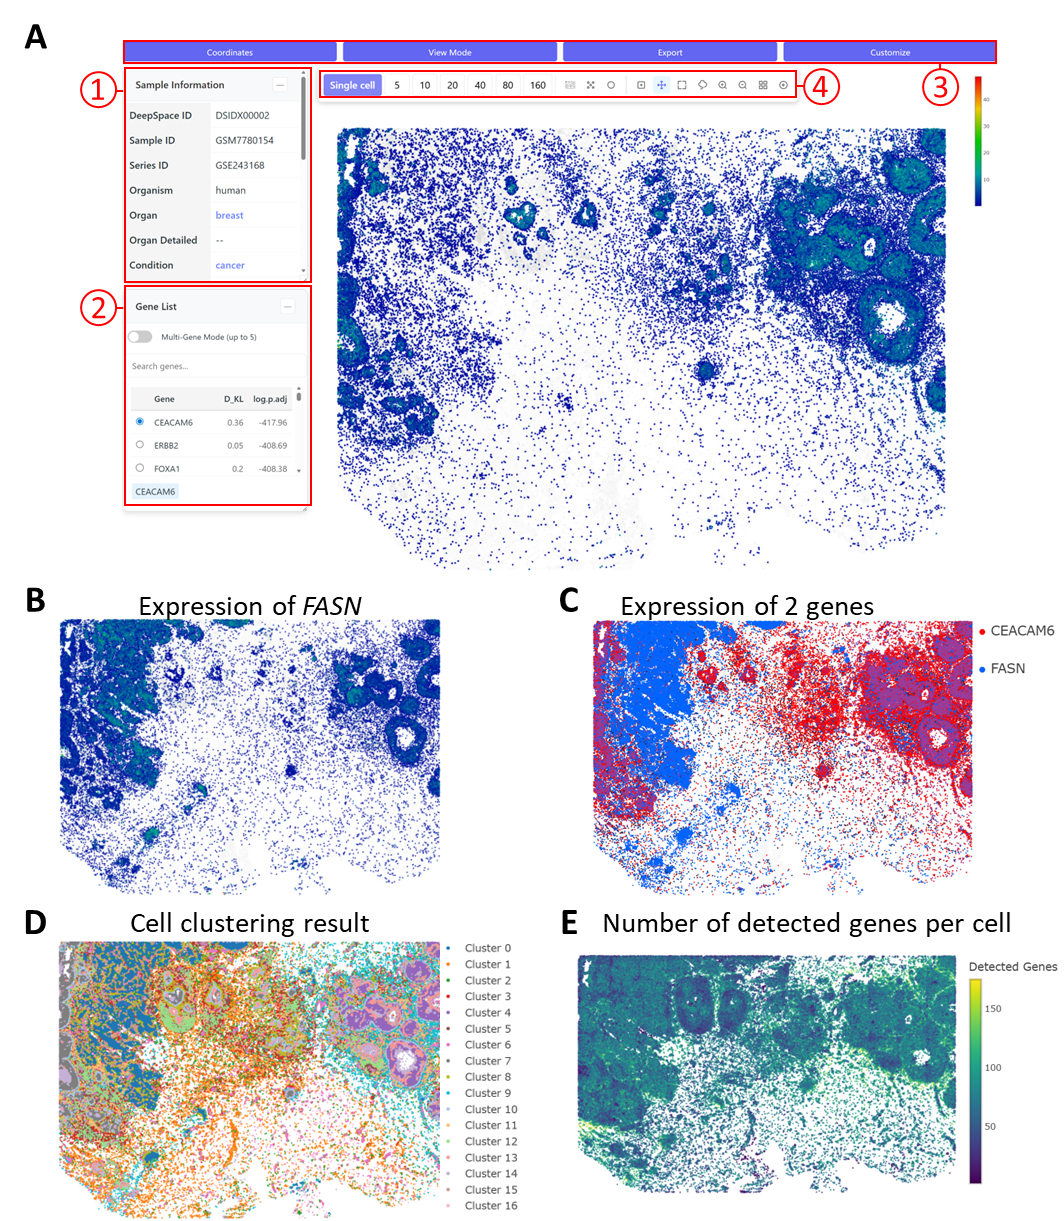
Fig 2: Comparison of gene expression between arbitrarily selected regions(DSIDX00002)
A: main Xenium interface ① sample information, ② a gene list, ③ 4 submenus ("Coordinates", "View Mode", "Export" and "Customize"), and (④) a tool bar. The gene list includes all genes sorted by the strength of their spatial pattern, as predicted by singleCellHaystack. By default, the highest-scoring gene is plotted (here: CEACAM6).
B: Expression pattern of FASN, another spatially variable gene.
C: Users can plot the expression of several genes in 1 plot. This plot shows the expression pattern of CEACAM6 and FASN.
D: The clustering result can also be visualized By changing the coordinates in the "Coordinates" submenu, the sample result can be seen in a UMAP plot.
D: The clustering result can also be visualized By changing the coordinates in the "Coordinates" submenu, the sample result can be seen in a UMAP plot.
E: Users can also visualize quality measures, such as the number of detected genes per cell.
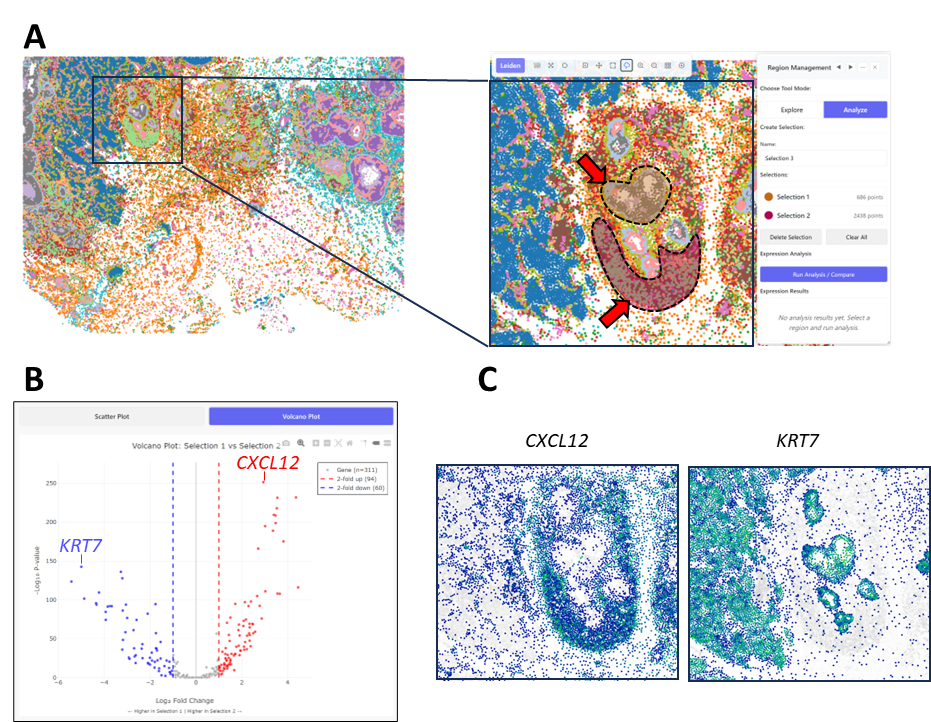
Fig 3: Comparison of gene expression between arbitrarily selected regions(DSIDX00002)
A: Zoom in on a part of the sample. Then, using the selection tool, we select 2 regions of interest (indicated by the arrows). By clicking "Run Analysis / Compare", we can compare the gene expression patterns in the selected regions.
B: Volcano plot of gene expression differences between the 2 selected regions. Two differentially expressed genes are indicated, CXCL12 and KRT7.
C: Visualization of the expression patterns of the two indicated genes, confirming the difference in their spatial pattern.
Terminology
Visium:A sequencing-based spatial transcriptome analysis technology of 10x Genomics. Different barcoded oligo DNA is attached to each spot, approximately 55 µm in diameter, densely arranged in an area of 6.5 x 6.5 mm on a glass slide. A tissue slice is placed on top of this to capture mRNA and measure gene expression for each spot area. It is said that one spot area typically contains several to around 10 cells.
Xenium: A high-resolution in situ spatial profiling technology of 10x Genomics. It hybridizes a special padlock probe with two gene-specific binding arms and a central region to target mRNA, amplifying it and detecting it by fluorescent imaging. This process repeats multiple cycles to examine the expression levels of up to 5,000 genes. By combining this with nuclear staining images, it is possible to measure the expression levels of specific genes in each cell.
Zarr format:A data format for efficiently storing and processing large multidimensional array data. Data is divided into small areas called "chunks" and stored, and only the necessary parts are read on demand. This allows for the handling of large amounts of data without having to load the entire data into memory, and it is becoming increasingly popular in fields such as life sciences that handle large amounts of data.
Related Links
- "DeepSpaceDB 2.0: an interactive spatial transcriptomics database for large-scale Xenium data exploration" | bioRxiv
- Spatial Transcriptomics Database DeepSpaceDB
- "Development of a database for spatial genomics data analysis " | NBDC
Outline of the project, etc.

