New analysis tools to support analysis and review have been implemented in the plant coexpression database "ATTED-II"
- Others
- Funding
- Database Integration Coordination Program
On September 27, 2024, Professor Takeshi Obayashi and his colleagues at the Graduate School of Information Sciences of Tohoku University have added new features to a plant gene coexpression database "ATTED-II".
Recent years, various plants have been studied with Next-generation sequencers. However, in "non-model plants" including practical plants such as crops and vegetables, the functions of many genes are still unknown, in contrast to "model plants" such as Arabidopsis thaliana which has been well studied in the laboratories. While various research approaches have been taken by researchers, one useful strategy is to examine groups of genes whose expression levels correlate and change under specific conditions or environments (genes in a coexpression relationship, referred as "coexpressed genes"). This is because coexpressed genes are often responsible for a series of some physiological functions together and are expected to be useful in understanding the functional cohesion and complex regulatory relationships of these genes. However, it is common for a single gene to be included in independent coexpression modules that function in different conditions and environments, then it was necessary to have a complicated analysis by specialists to understand properly.
ATTED-II has been developed since November 2004. It collects transcriptome data of major publicly available plant species, mainly model plants such as Arabidopsis, and analyzed in large scale. And it has been widely used as a database to search for coexpressed genes. However, even after identifying similarities in expression patterns among genes, it was not easy to identify the conditions and environmental factors involved in their coexpression, only with the functions in ATTED-II so far.
In this update, a new tool, "PC View," has been implemented to analyze the Principal Component (PC) of a coexpression relationship. PC View can be used to examine the conditions and environments under which two genes of interest are coexpressed. And newly implemented "CoexViewer"" allows users to view a correlation diagram of the expression patterns of the two genes of interest. These two tools help the users to better understand the physiological functions of the coexpressed genes and their regulatory relationships.
In addition to the above new features, information of wheat and barley has been added, enabling the viewing of coexpression information for a total of 11 plant species. And, in "NetworkDrawer", in which displays the correlation of coexpressed genes as a network, paralog information (genes with the same KO and KEGG Orthology) can be displayed. Furthermore, a link to Plant GARDEN (Genome And Resource Database Entry), a portal site that curates genome and marker information of various plant species, has been added from the gene information.
These new implementations to ATTED-II will also be presented the 1st Asia & Pacific Bioinformatics Joint Conference at Naha Cultural Arts Theater NAHArt on Oct 22 to 25, 2024.
ATTED-II is developed as a part of JST Database Integration Coordination Program (DICP), "Platform of gene network information for non-model plants (Principal Investigator: OBAYASHI Takeshi, Professor, Graduate School of Information Sciences, Tohoku University)".
< Plants included in ATTED-II (Total 11 species)>
- Arabidopsis
- Field mustard
- Soybean
- Medicago
- Rice
- Poplar
- Tomato
- Grape
- Maize
- Wheat (New)
- Barley (New)
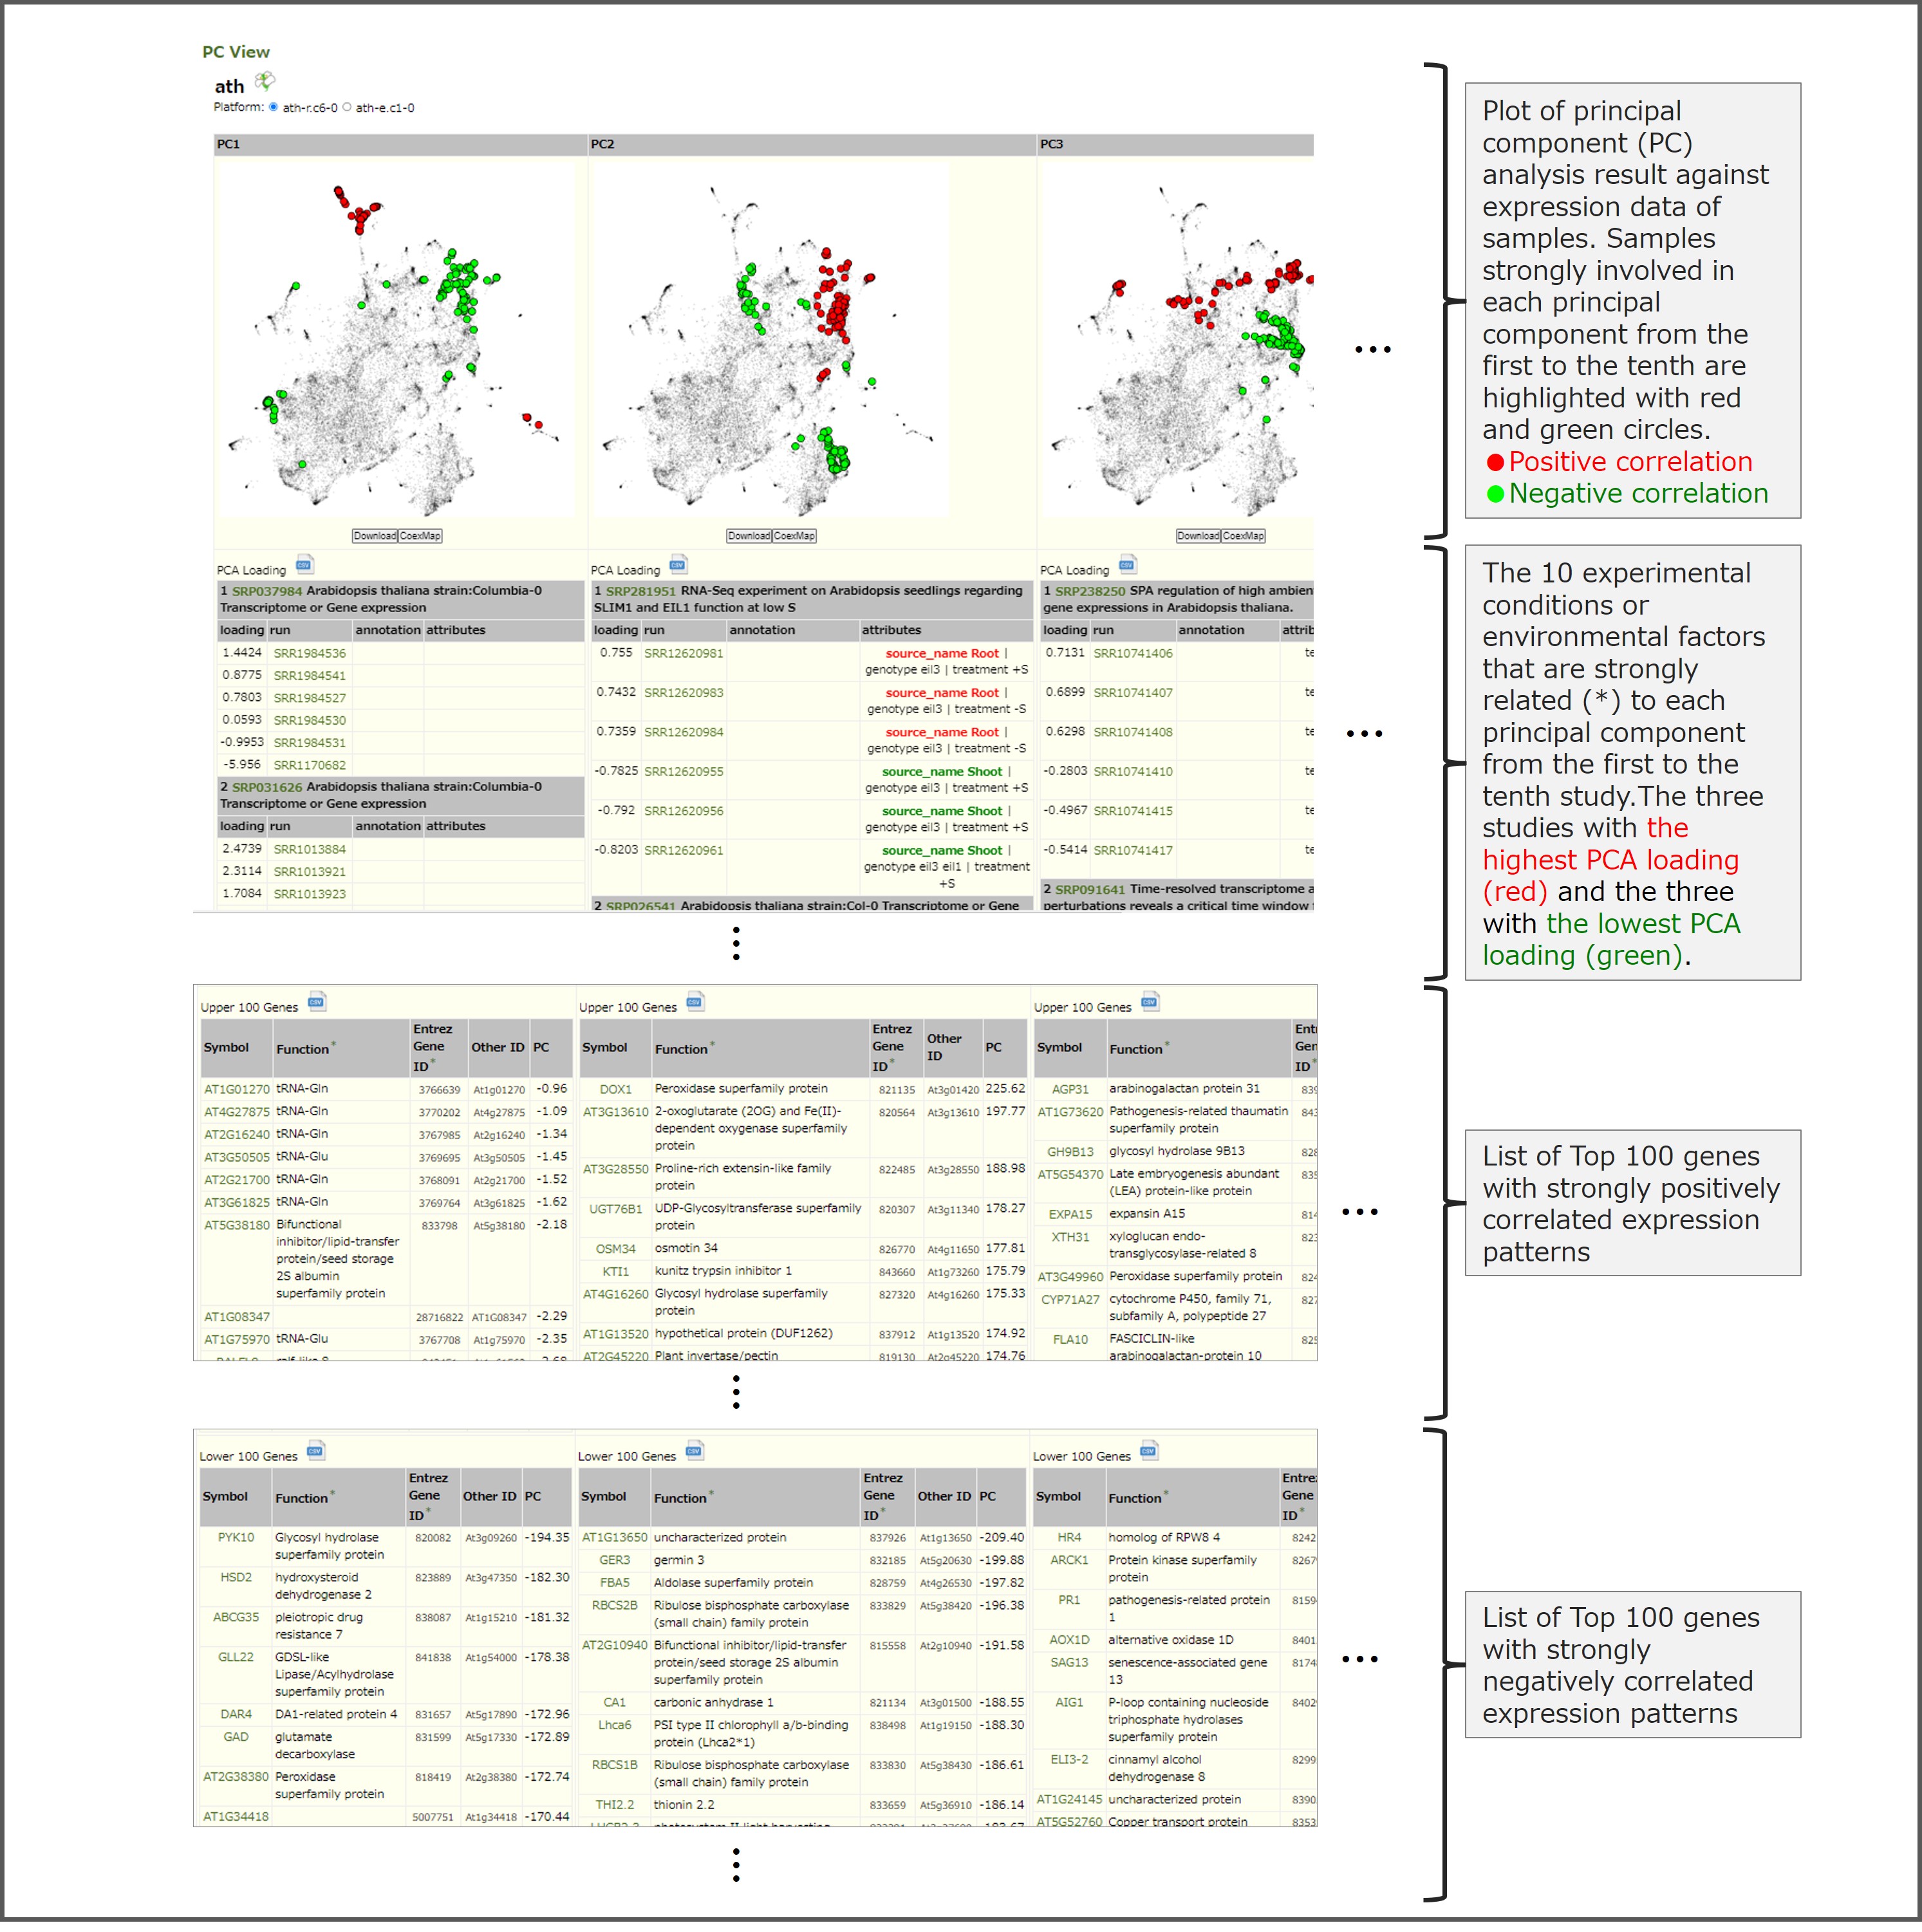
PC View is a page describing PCs (principal components) of gene expression data that can be estimated as a metasample to understand individual coexpression relationships, and this figure is a screen capture of PC View for Arabidopsis thaliana as an example. PC View provides the following four types of information. (1) Principal Components analysis (PCA) results plotted against sample expression data. Samples strongly involved in each PC from the first to the tenth can be confirmed by displaying red and green circles. (2) Ten studies including six representative samples (the three samples with the highest PCA loading (red) and the three samples with the lowest PCA loading (green)) that are strongly involved in each PC from the first to the tenth. (3) A list of the top 100 genes whose expression levels are positively correlated. (4) A list of the top 100 genes whose expression levels are negatively correlated. The listed genes may have related physiological functions or regulatory relationships.
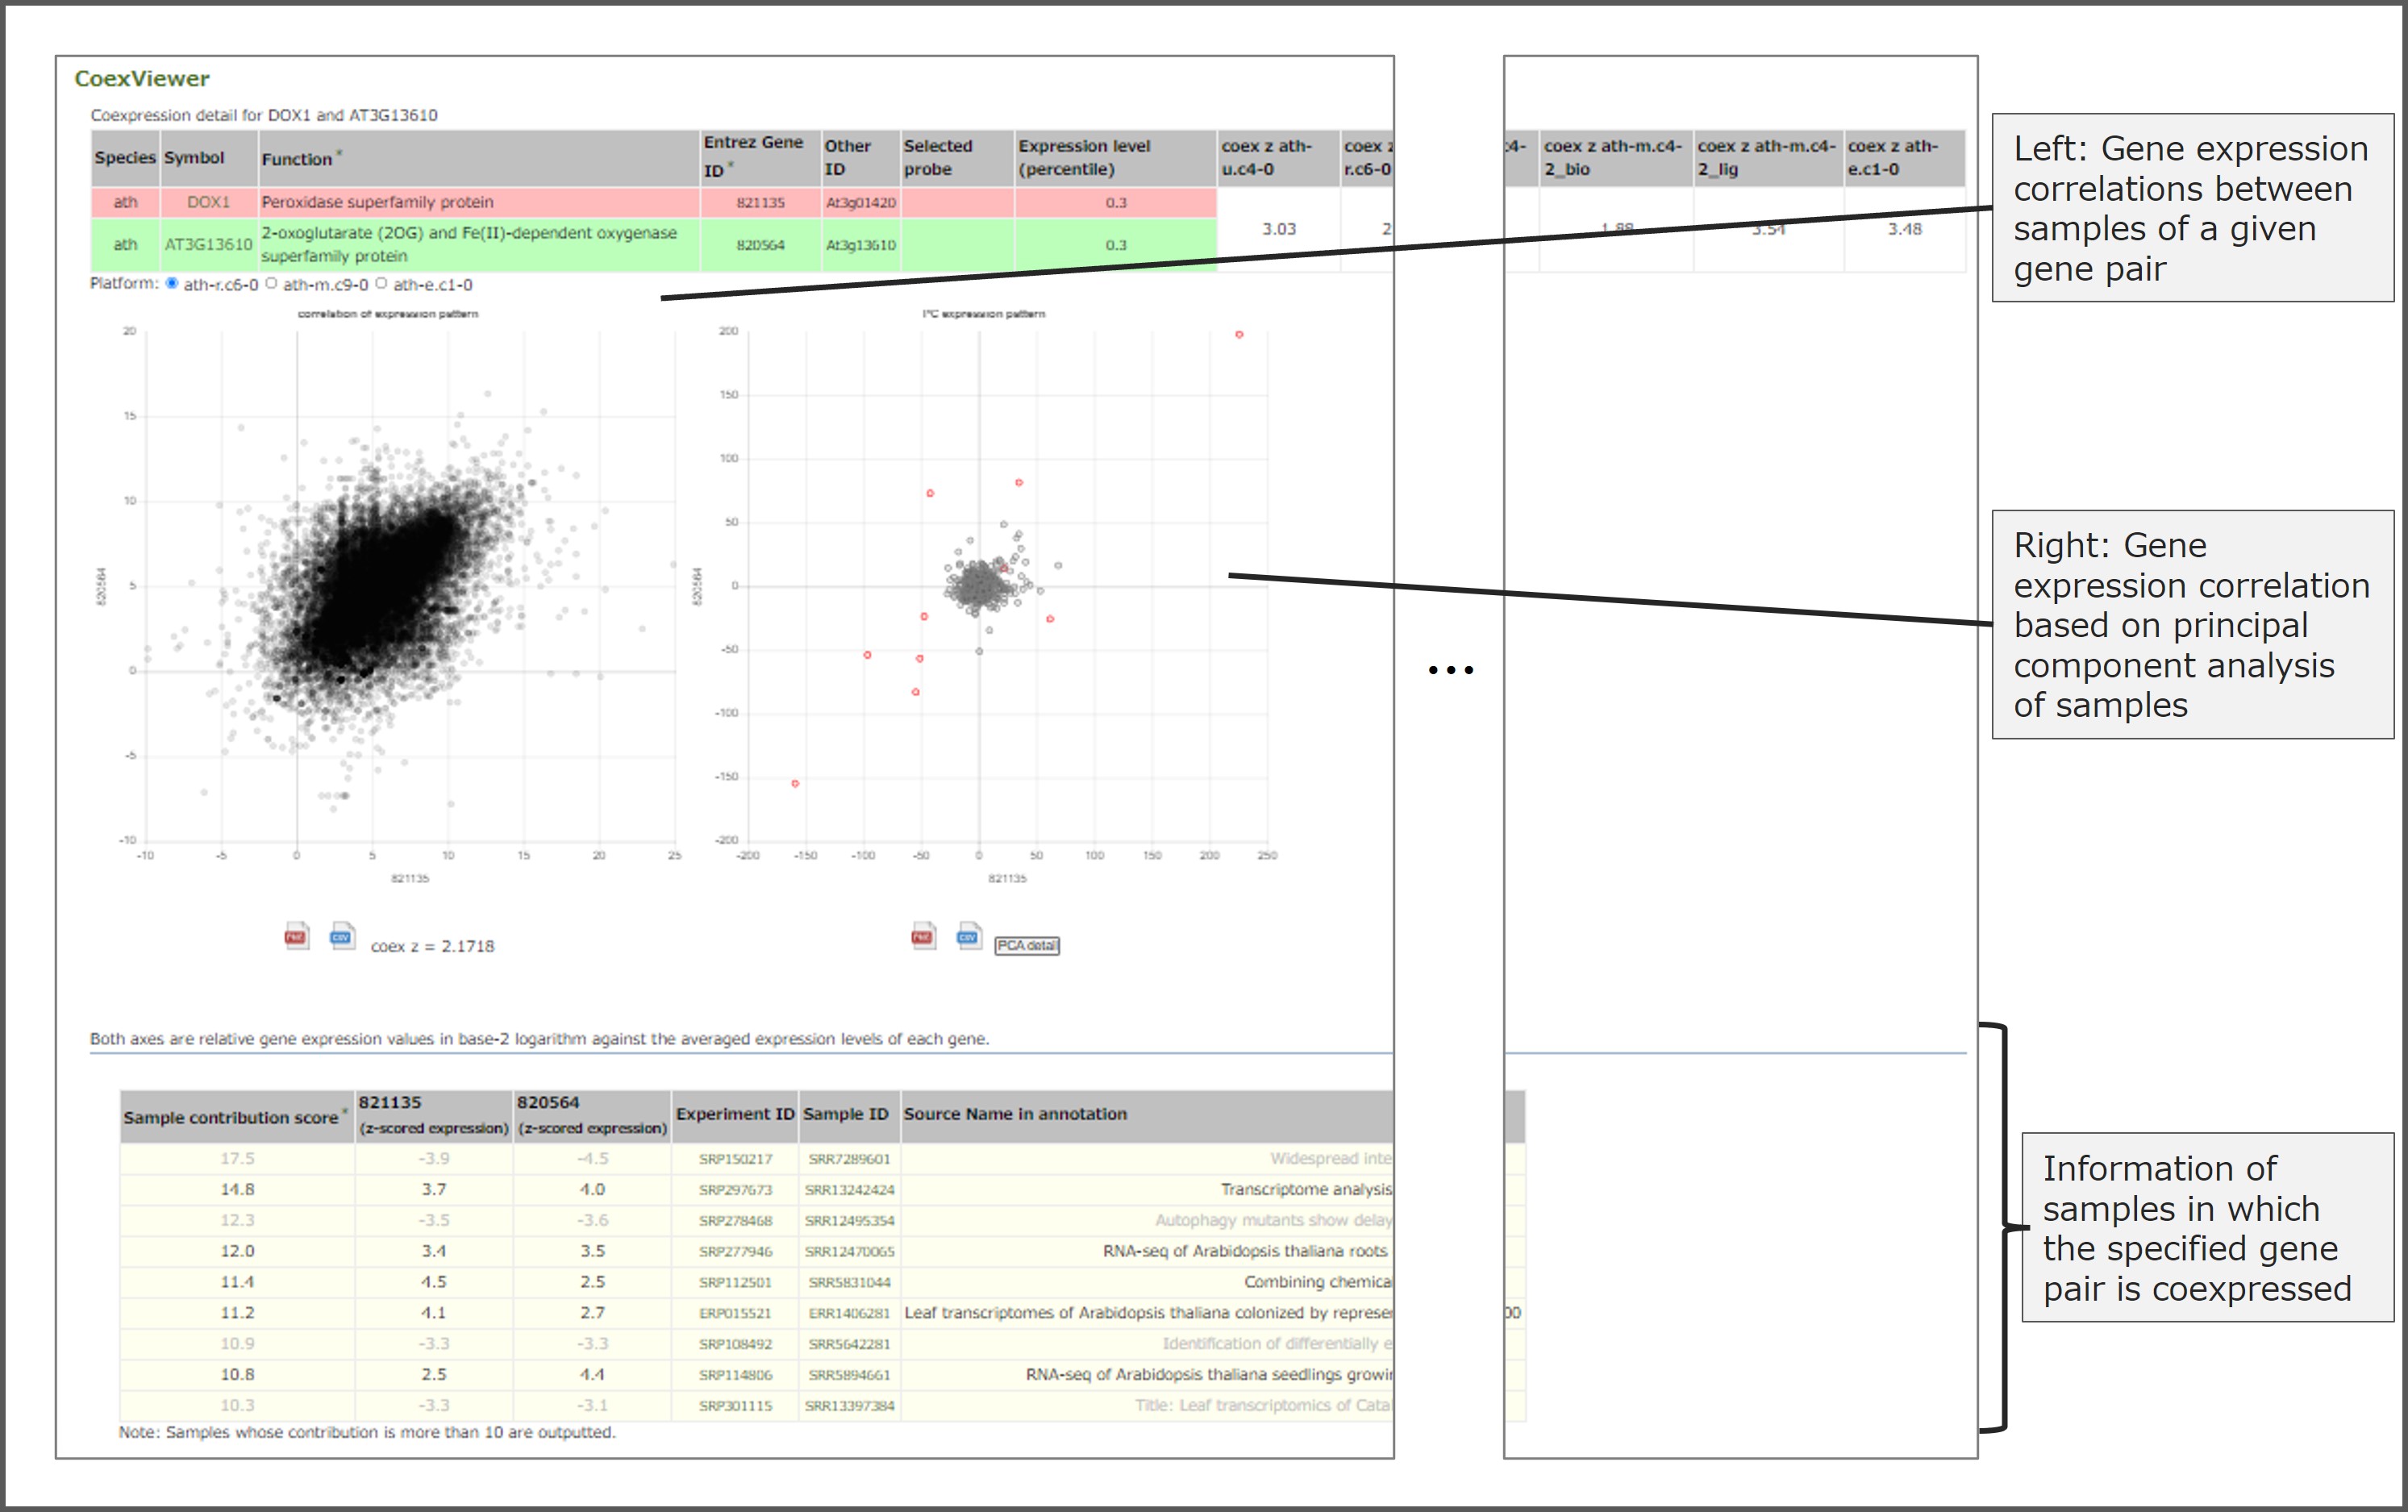
CoexViewer is a tool that displays gene expression correlations for specified gene pairs. As an example, this figure shows a screen capture of the results displayed by CoexViewer for Arabidopsis DOX1 (Peroxidase superfamily protein) and AT3G13610 (2-oxoglutarate and Fe(II)- dependent oxygenase superfamily protein) in CoexViewer. In addition to gene expression correlations among samples, gene expression correlations based on principal component analysis of the samples are also shown. By interpreting the sample principal components in which a given gene pair is strongly coexpressed, it becomes possible to understand the biological meaning behind the coexpression.
Related Links
- ATTED-II
- Platform of gene network information for non-model plants - A Funded Project | NBDC
Outline of the project, etc.

