
PHi-D, a database for the comprehensive analysis and visualization of dynamic 3D genome structures (4D genome states), has been released
- Others
- Funding
- Database Integration Coordination Program
On Oct 5, 2026, Senior Researcher Soya Shinkai and colleagues at the RIKEN Center for Biosystems Dynamics Research released PHi-D - a database that comprehensively analyzes and visualizes dynamic 3D genome structures (4D genome states) based on public 3D genome structure data (Hi-C data).
The genomic DNA of eukaryotes is folded into a structure known as chromatin within the cell nucleus, forming a complex three-dimensional higher-order structure. This DNA is not merely stored statically within the cell; it is in constant motion. It is becoming clear that characteristic genome folding patterns shift in response to the cell's state, playing a role in processes such as switching gene expression on and off. In recent years, the Hi-C (High-throughput chromosome conformation capture) method-which investigates the three-dimensional structure of the genome based on spatial interactions-has been advancing rapidly. However, since the Hi-C method involves chemically fixing cells for analysis, the information obtained is merely "static structural information" representing an average across many cells; it could not reveal the "dynamic structural information" regarding how chromatin fluctuates and moves over time within living cells.
In 2020, Dr.Shinkai and colleagues developed a computational method called "PHi-C" (Polymer dynamics simulation from Hi-C data) to reconstruct and analyze the dynamic three-dimensional genome structure (4D genome state) based on Hi-C data. The newly released PHi-D contains results on 4D genome states obtained through comprehensive PHi-C analysis of public Hi-C datasets. For each dataset, the platform provides interactive contact maps displaying experimental Hi-C data alongside PHi-C model fits; dynamic simulations of 3D genome structures featuring animation and color-coding capabilities; MSD and loss-tangent maps characterizing structural flexibility and dynamic viscoelasticity; and a 1D genome viewer for navigation-serving as an interactive platform for exploring and sharing PHi-C-analyzed Hi-C data. The panels are linked to one another; zooming in or hovering the mouse over one panel causes the corresponding genomic location to be displayed in the other panels as well.
Dr.Shinkai et al. reported the establishment of a chromatin physical model (a 'digital twin') that provides a unified description of the structure and dynamics of the Schizosaccharomyces pombe (fission yeast) genome in the scientific journal Proceedings of the National Academy of Sciences of the United States of America (PNAS) on Sep 8, 2026. This model was created by integrating whole-genome Hi-C data analysed using PHi-C with data from a live-cell imaging platform capable of simultaneously tracking 131 genomic loci, the spindle pole body (SPB), and the nucleolus. A joint press release regarding this study was issued on Sep 17, 2026 by Hiroshima University, Osaka University, and RIKEN. The study identified specific chromatin regions located near centromeres/telomeres and on chromosome arms that exhibit distinct lag time compared to other regions. Furthermore, the study elucidated the mechanism by which low-frequency fluctuations originating at the extranuclear SPB propagate across the entire genome via the centromeres to drive chromosomal movement. This is the world's first report to successfully achieve a quantitative understanding of the physical mechanisms governing chromatin dynamics by integrating structural and dynamic data through mathematical and physical approaches.
Although the analytical example in the above paper involves fission yeast, which has a relatively small genome, this method, in principle, can also be applied to more complex and larger genomes, such as the human genome. Thus, the methodology of 'interpreting genomic motion through the lens of physical laws' using PHi-C data obtained from PHi-D represents a research achievement that advances the perspective of life sciences by shifting the focus from studying DNA as a 'static blueprint' to investigating how DNA moves. Dr. Shinkai also mentioned that this approach is expected to contribute to the future elucidation of the mechanisms of diseases involving 'physical disturbances' in the genome, such as aging, carcinogenesis and DNA damage.
The development of PHi-D is being carried out in the R&D project "Development of the PHi-C database to support the understanding and visualization of 4D genome states" (Principal Investigator: Soya Shinkai, Senior Scientist, RIKEN Center for Biosystems Dynamics Research) under the Program for Promoting the Integration of Databases.
< Number of entries in PHi-D > (As of October 5, 2026)
- 230 bioresources; 1,082 experiments (15,995 chromosomes)
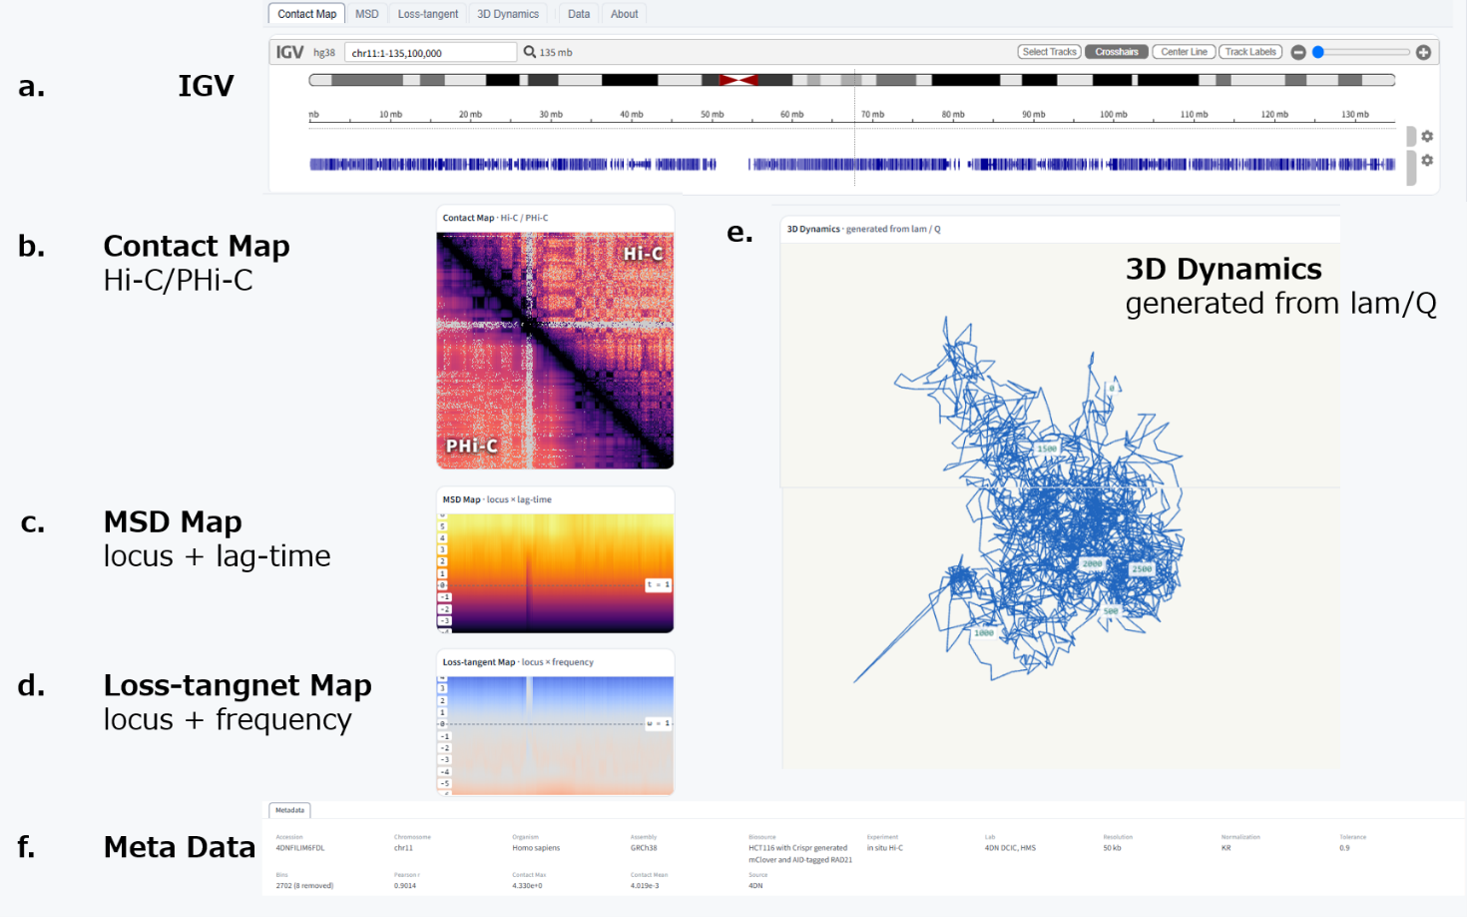
Fig: PHi-D Results Display Screen
a. IGV displays the chromosome currently being viewed. The region shown is indicated by a red frame that updates in sync with the zoom level of each panel.
b. The Contact Map displays Hi-C experimental results in the upper-right half and PHi-C prediction results in the lower-left half.
c. The MSD Map shows chromosomal loci on the horizontal axis and lag time on the vertical axis, illustrating the flexibility of the genome structure.
d. The Loss-tangent Map displays the chromosomal locus on the horizontal axis and the frequency (angular frequency) on the vertical axis, representing the physical and dynamic viscoelasticity of the genome.
e. 3D Dynamics pannel displays the spatial positional relationships of the genome within a 3D genome structure model and allows you to view the results of real-time dynamic simulations. You can zoom in or out and rotate the display using the mouse. The panels are linked each other; for instance, clicking any position on the Contact Map highlights the corresponding residue locations on the MSD Map and Loss-tangent Map, while simultaneously connecting the relevant points with a red line in the 3D Dynamics view.
f. Metadata for the displayed 4D genome data is shown.
Glossary of Terms
Hi-C (High-throughput chromosome conformation capture) method: An experimental technique for comprehensively analyzing the three-dimensional higher-order structure of genomic DNA-which is folded three-dimensionally within the cell nucleus-across the entire genome. DNA segments that were spatially close to one another are cross-linked (using agents such as formaldehyde), fragmented, and recovered; their sequences are then comprehensively read using next-generation sequencers and mapped. This process reveals which genomic regions were physically proximal and allows for visualization via tools such as a two-dimensional heat map known as a "contact map."
PHi-C (Polymer dynamics simulation from Hi-C data): A computational method for reconstructing and analyzing dynamic 3D genome structures (4D genome states) based on 2D Hi-C data. When Hi-C data (represented as a 2D heat map) is input into the PHi-C method, it yields optimal interaction parameters for a polymer model that reproduces the input data with a correlation of over 90%. By using these interaction parameters, one can simulate the 4D dynamics of the polymer model in a manner consistent with the static input Hi-C data, thereby enabling the analysis of the genome's dynamic properties.
MSD (Mean Squared Displacement): A physical metric quantifying how a specific genomic locus fluctuates over time (reflecting structural flexibility).
Loss-tangnet: A physical metric quantified as the ratio of the loss modulus to the storage modulus (indicating the degree of energy loss); it represents the physical and dynamic viscoelastic properties of a specific genomic locus.
Related Links
- PHi-D (PHi-C database)
- Software "PHi-C2"
- "Integrative modeling of the genome structure and dynamics in fission yeast" | PNAS
- Press Release "Recreating genome structure and dynamics in silico: World's first 'genome digital twin' of fission yeast" | Hiroshima University
- "PHi-C: deciphering Hi-C data into polymer dynamics" | NAR Genomics and Bioinformatics
- Construction of a database to support the understanding and visualization of 4D genome states | NBDC
Project summaries and reports are posted.

