KEGG Syntax: An analytical tool for comprehensively comparing and analyzing the genomes of various species based on KEGG data to understand phylogenetic relationships
- Others
- Funding
- Database Integration Coordination Program
On May 21, 2026, Professor Minoru Kanehisa of the Institute for Chemical Research at Kyoto University and his colleagues developed a tool called KEGG Syntax (Synteny and Taxonomy) , which characterizes biological groups based on combinations of KEGG Orthology (KO) terms and compares the similarity among them. Their findings were published in the scientific journal "Protein Science."
Among KEGG's web tools, KEGG Mapper has been implemented; this tool automatically maps lists of genes and proteins onto KEGG metabolic pathways and network maps for visualization and analysis. While KEGG Mapper is a suite of tools designed to decipher functional information about biological systems from genomic data, the newly developed and implemented KEGG Syntax is a suite of tools that uses information such as KEGG Orthology (KO) and Virus Ortholog Groups (VOG) to compare and analyze gene order similarities (synteny) and conserved gene sets across multiple species and viruses.
KEGG Syntax consists of the following three tools. The first is the "Genome Alignment Tool," which compares the order of similar genes using KO and VOG data. It aligns the order of similar genes in two genomes by comparing sequences using a gene similarity metric based on the Goddard-Kanehisa algorithm. This allows the tool to identify all "syntenic regions" with locally similar gene orders between the two genomes. The second is the "Genome Similarity Tool," which evaluates the similarity of genomes characterized by KO sequences. Here, the genomes of organisms or viruses are characterized by their KO or module composition (unique sets), and three simple genome similarity metrics have been introduced to rapidly identify similar genomes and groups of organisms. The third is the "Taxonomy Mapping Tool," which maps data to a Brite-formatted taxonomic file based on combinations of orthologs (KO K-numbers) and module M-numbers, and visualizes their evolutionary relationships as a dendrogram in the KEGG Classification Browser. By using these tools to compare and analyze the genomes of various organisms from multiple perspectives, it is possible to explore the big picture of life based on the phylogenetic relationships of organisms, biological groups, and viruses, using conserved genes such as KOs and VOGs, as well as conserved gene sets that include modules and conserved gene sequences.
In addition, these tools enable the analysis of user data, It provides the "KO Composition Analysis Tool," which allows users to search for similar KEGG entities or KEGG groups by using a series of KOs (K numbers) as a query and applying various similarity metrics, and the "KO Sequence Analysis Tool," which identifies conserved synteny based on the alignment between the KO order (gene order) and KEGG entities when KOs are associated with an ordered set of genes within a genome.
For more details, please refer to the published paper titled "KEGG Syntax for Comparison of Organisms, Organism Groups, and Viruses by Conserved Gene Repertoires"
KEGG Syntax is developed as part of the JST Program for Database Integration Coordination Program (DICP), "Integrated database linking human and pathogen genomes to diseases and drugs " (Principal Investigator: KANEHISA Minoru, Professor, Institute for Chemical Research, Kyoto University).
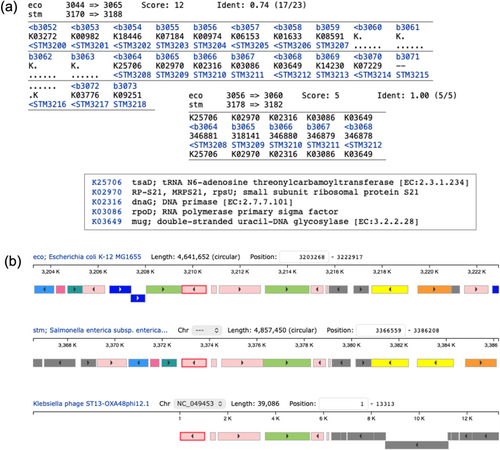
Figure 1: Example of Using the Genome Alignment Tool
Gene orders in the Escherichia coli (eco) and Salmonella enterica (stm) genomes are compared both as KO sequences and VOG sequences. (a) A local alignment of five genes is identified by VOG sequences (lower), while a longer alignment containing this five-gene segment is identified by KO sequences (upper). (b) From the precomputed VOG alignment dataset, the five-gene segment is also found in Klebsiella phages. KEGG genome browser is used to compare three genomes, including a phage genome, by aligning three genes, eco:B3064, stm:STM3208 and vg:55812000. Color coding of genes (boxes) indicates the functional category of KOs.
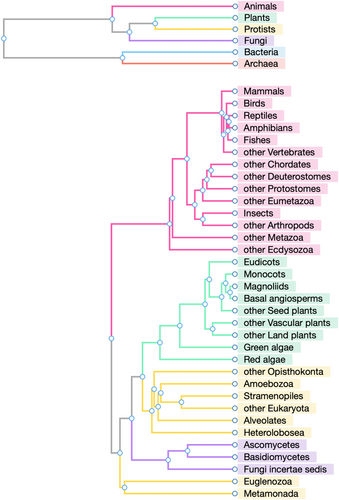
Figure 2: Example of Using the Taxonomy Mapping Tool
Taxonomy Mapping Tool allows comparison of organism groups by the combined KO composition and displays resulting similarity dendrograms, in addition to comparing individual organisms. The dendrograms shown here are for the similarity relationships of six top-level groups and 34 second-level groups of eukaryotes. Coloring is based on the top-level groups. These dendrograms indicate the distinction of eukaryotes and prokaryotes (or the similarity of bacteria and archaea) and the diversity of eukaryotes other than animals, plants, and fungi, collectively named protists.
Related Links

